My Role: Garage Lead – Led design, research, and development
Team: CEO: Arian Bakhtiarnia, Electronics Engineer: Abolfazl Ghamgosar, Mechanical Prototype Engineer: Abbas Sohrabi, Software Engineer: Farzad Karamouz, Data Analyst: Melika Farahani
Balad Company
2020
Behind the Scenes of Garage Innovation Lab
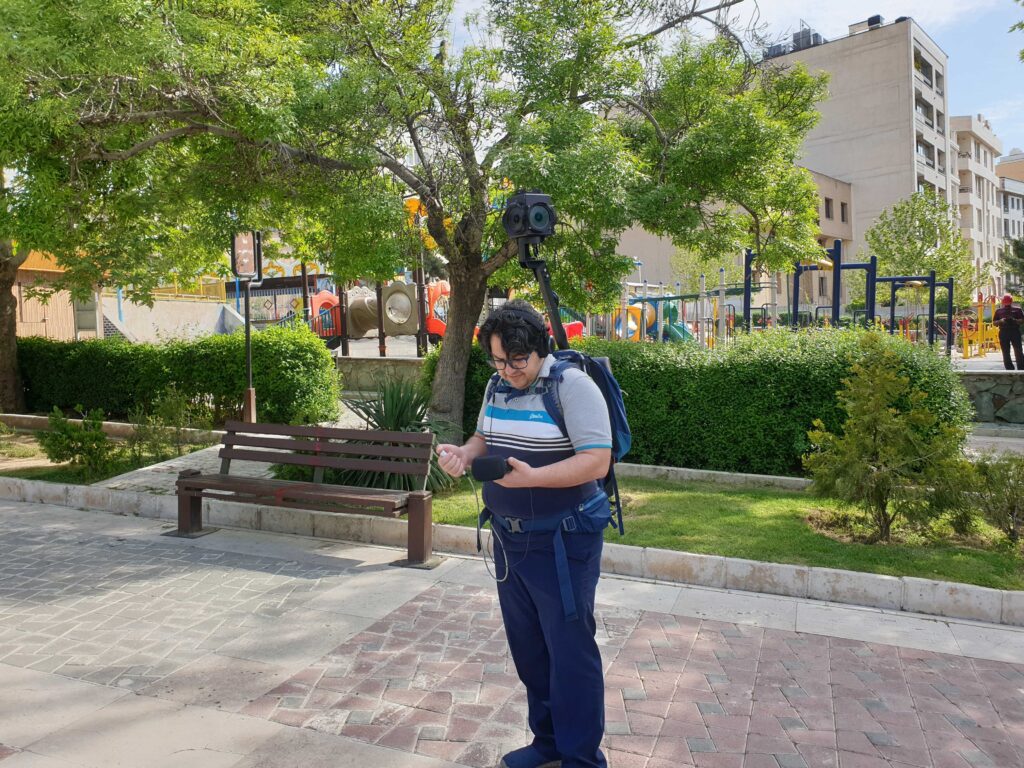
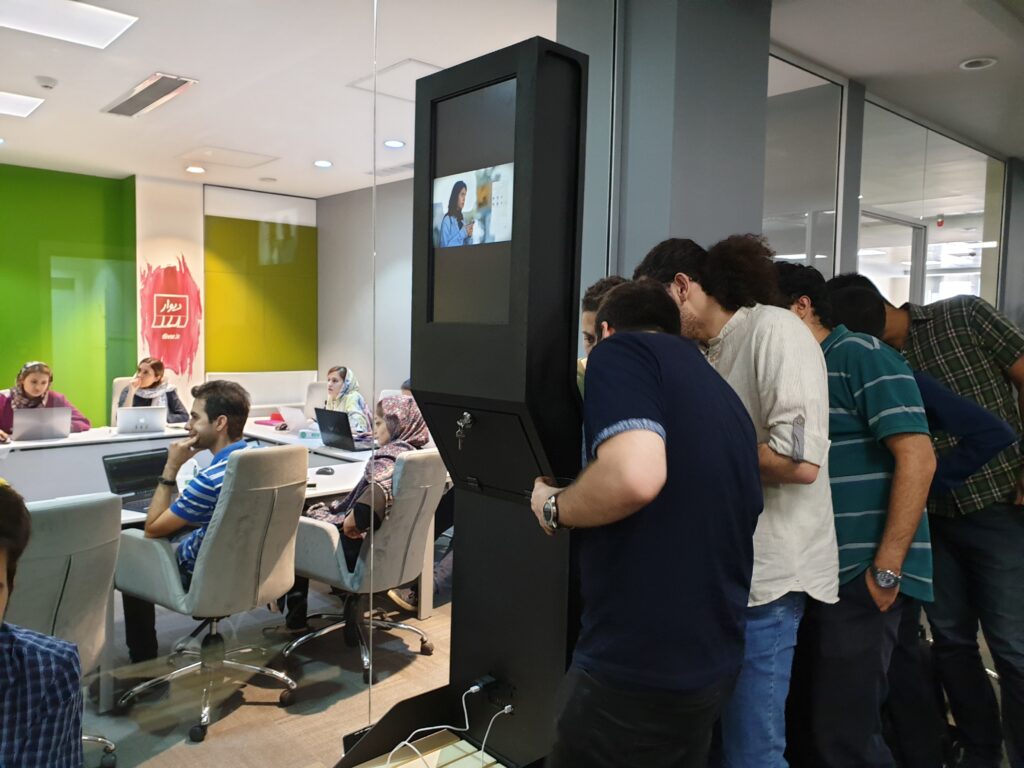
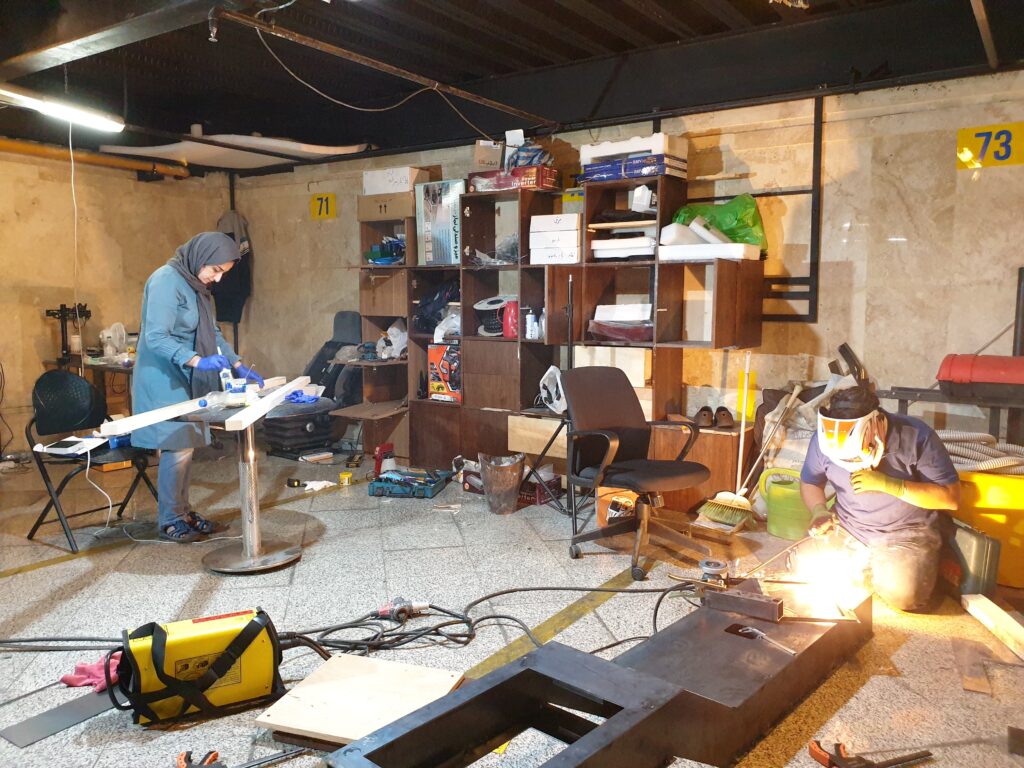
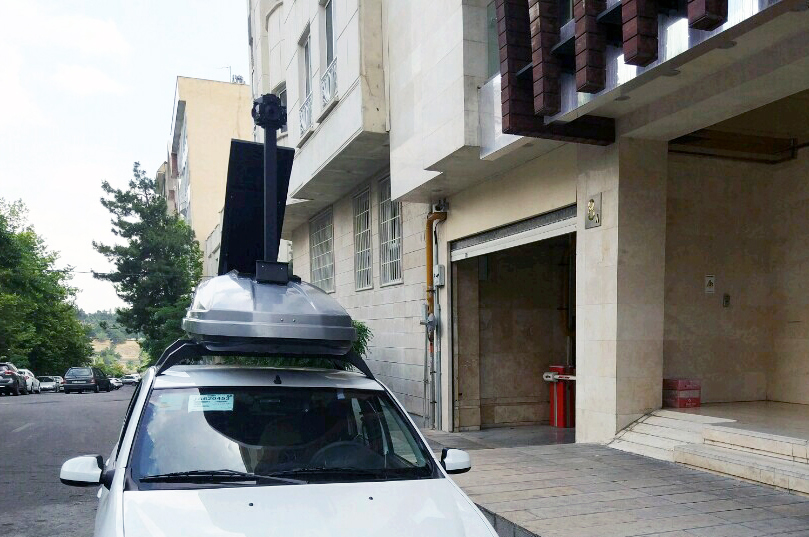
I co-initiated Balad Garage as the company’s first interdisciplinary team beyond software. Garage is dedicated to gathering deep information from cities and promoting innovation in urban technologies. We are a team of five: a Mechanical Engineer, an Electronics Engineer, a Data Analyst, a Full-stack Developer, and me as the Team Lead. What we practiced most at Garage has been pragmatism and rapid prototyping toward interdisciplinary iterative research and development. It is only by embodying this spirit that we could run a fleet of cars photographing Urban Points of Interest from around the country in a few months, design and fabricate a smart urban bench in three days, and conduct pedestrian 360 photography in a few weeks.
The Context of Air Pollution Project
Among 26 megacities of the world, Tehran, the capital of Iran, typically experiences more than 100 unhealthy days per year, ranking it as the 12th most polluted megacity. This normalized problem has crucial effects on mental and physical health, as well as the economy.
Defining The Challenges
In response to this wicked problem, at Balad, the market-leading consumer maps and navigation app in Iran, we, as the Garage Team, proposed to investigate how we could make a positive contribution. Our research showed that Balad’s role could include the following aspects:
1. How can we increase citizen accessibility of the already existing data?
2. How can we increase the density of data to better understand sources and patterns of pollution?
3. How can we engage citizens in participatory and citizen science practices of measurement?
The App
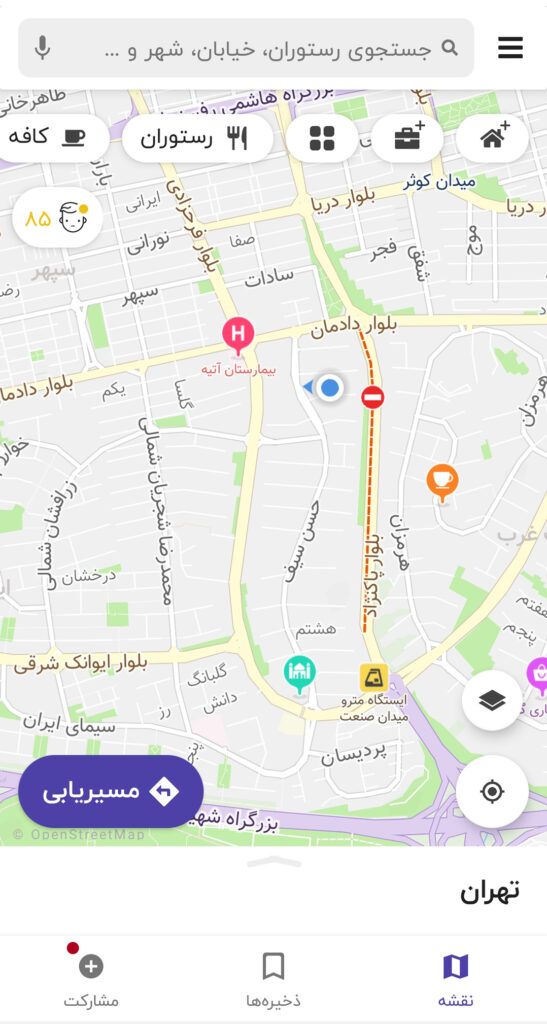
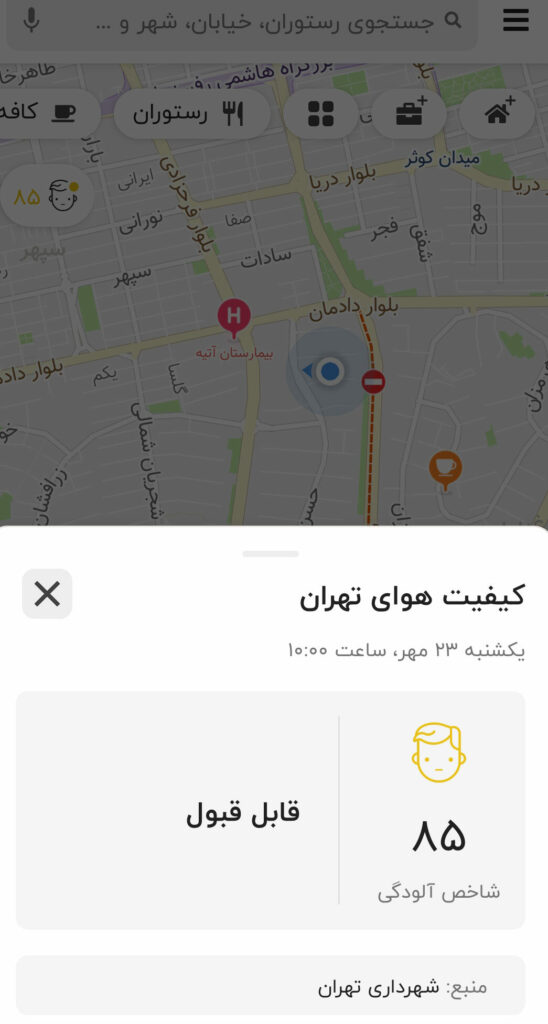
We collaborated with the municipality of Tehran to present their stations’ air quality data over the map to millions of users of the Balad mobile app. The conversation around the air quality feature has circulated on social media. Balad users continue to use the provided mobile app feature daily since 2020.
Research: The Low-Cost Sensors Kit
Goals
We evaluated the potential of low-cost sensors as an addition to the network of the city’s official air quality monitoring stations’ data to:
1. Achieve hyper-local measurement instead of regional measurement to gain a spatial resolution.
2. Increase the number of stations (low-cost) and eventually cover marginalized areas despite financial limitations.
3. Create a moving network of kits, developed by students and hosted by them, to send data during the kit’s lifespan.
Specific Questions
We were excited by the potential of the kit in responding to such questions:
“How air pollution is different…”:
- inside and outside Balad office and the city’s station?
- at various highways and tunnels?
- at parks and green areas compared to the surrounding neighborhood?
- across transportation modes, inside and outside buses, inside subway stations, inside subway, walking on street levels, inside and outside of a driving car?
- in proximity to main highways and away from them in the same neighborhood?
- at certain locations during the day and night and weekdays versus weekends?
- where are the best spots in the city for physical exercise during the healthy days?
- how kindergartens, schools, and hospitals are or are not exposed to unhealthy pollution?
Iterations of the Kit
In an iterative process, we researched and developed the sensing kit to achieve our desired accuracy.
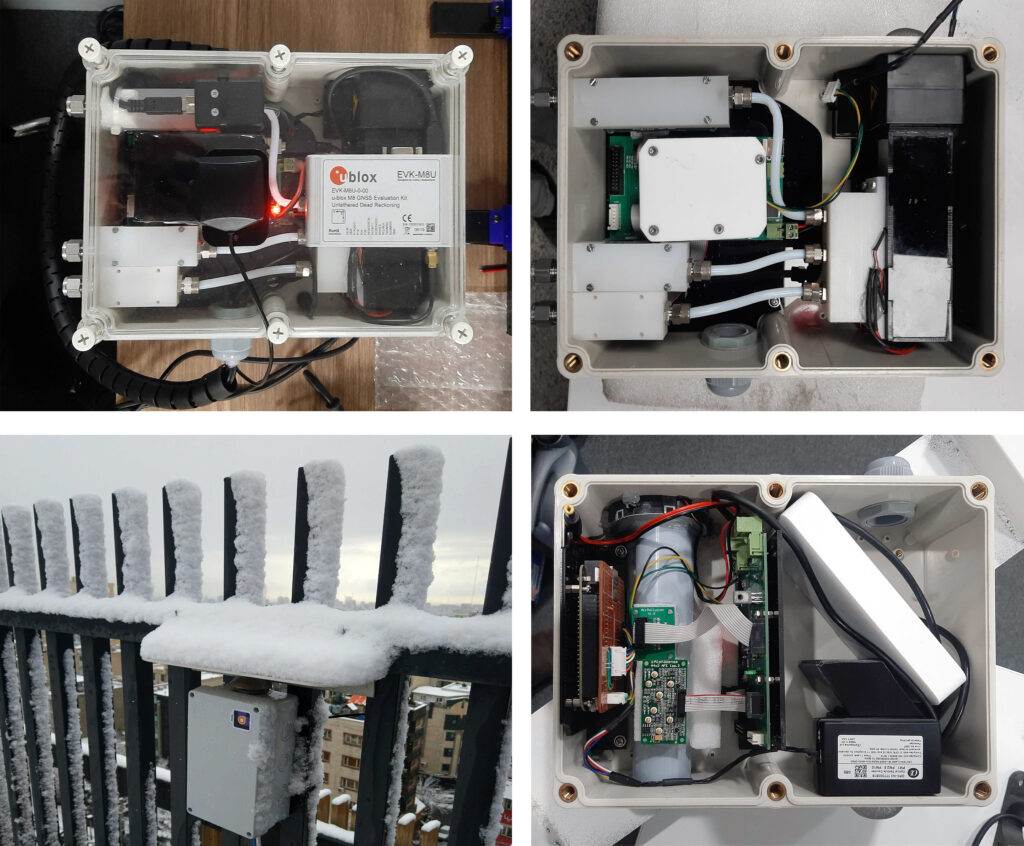
The Final Kit
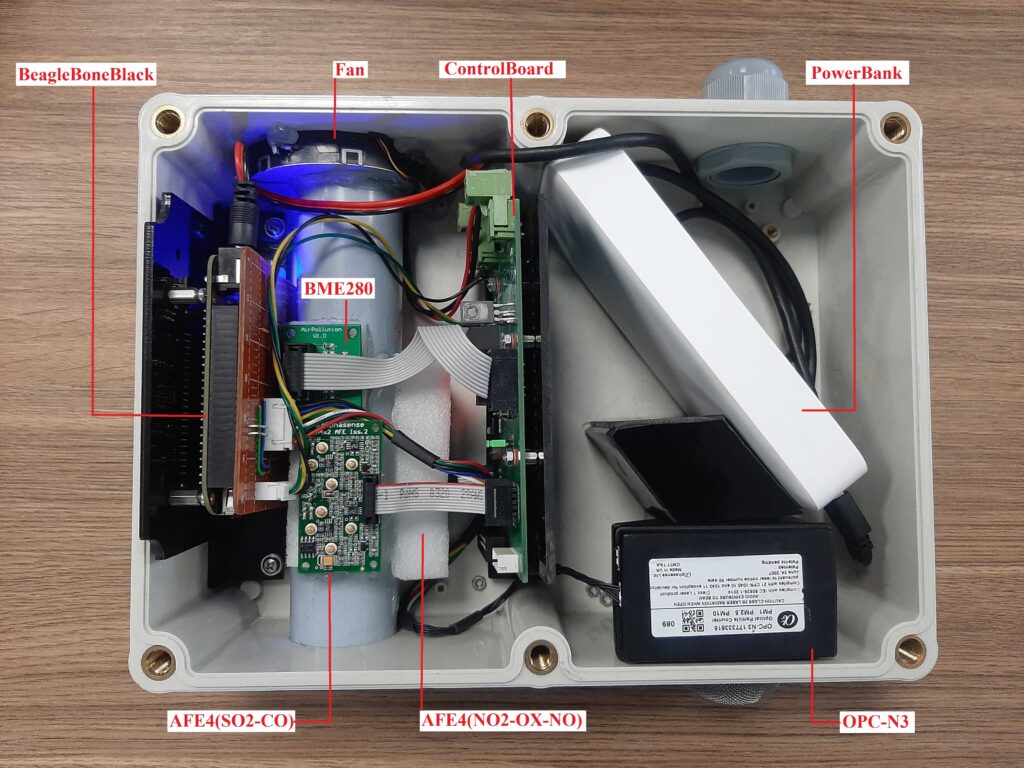
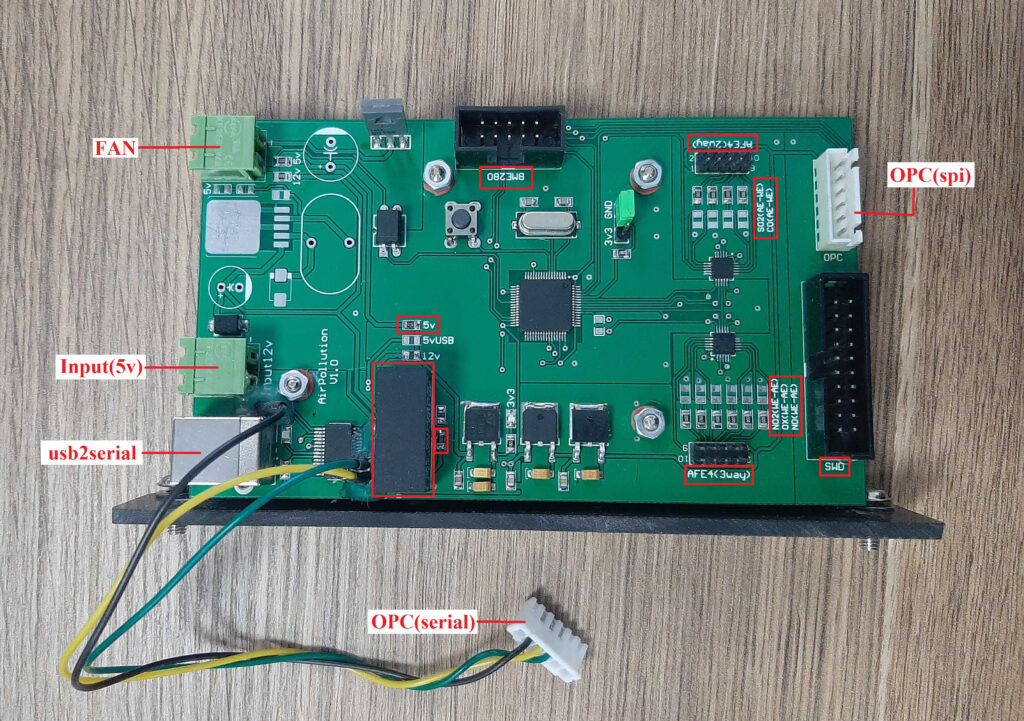
Balad Kits’ electronics hardware included:
- BeagleBone Black
- Custom Design PCB (Control Board)
- Alphasense 2-Way AFE A4 sensor for CO & SO2
- Alphasense 3-Way AFE A4 sensor for NO2 & O3 & NO
- Alphasense OPC-N3 (Optical Particle Counter) for PM1, PM2.5, and PM10
- Bosch BME280 sensor for Temperature, Humidity, Pressure
- 4G Module
- Ublox EVK-M8U GNSS Positioning Kit
- Xiaomi Redmi 10000 mAh Power Bank
- Fan
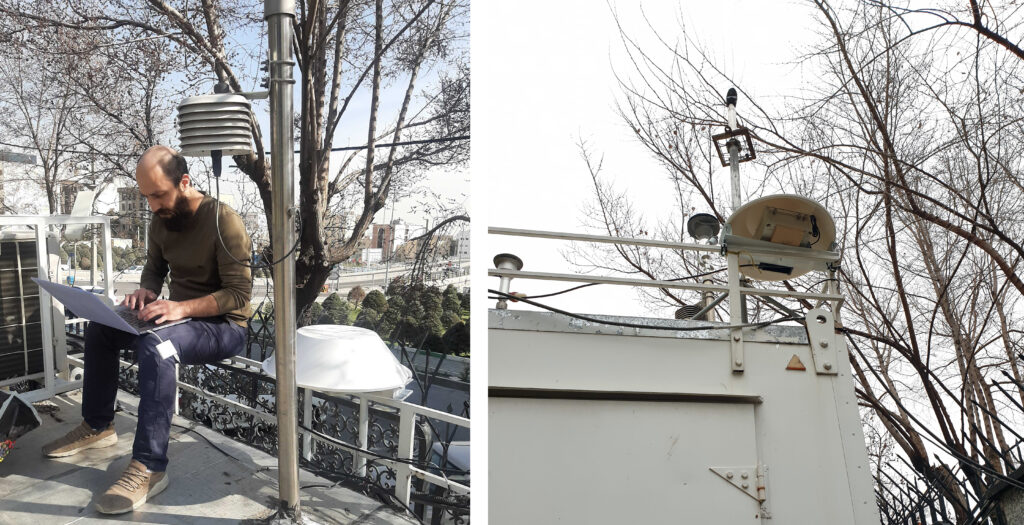
Calibration
We calibrated two kits of sensors by placing them next to the city’s stations for three months to gather data with different temperatures and humidity levels.
For calibration of each pollutant measurement, we tested various algorithms and parameters. Among various algorithms, Linear Regression performed the best for NO2, O3, CO, and PM10, with the model trained on 80% of the data and used to predict the remaining 20%. Overall, some of our results had more accuracy than similar works and research papers (1, 2, 3), and some need more work. We suggest gathering more data during other weather conditions and seasons.

Data readings: voltage (for electrochemical sensors), ppb (for particle counters) per second, calculation: hourly average, ppm (reference) / Period: 11 days / Algorithms: Naive Regression Models, ARIMA-X, Linear Regression, KNN Classifier, Trained with 80% of data and predicted 20% / Features: Temperature, Humidity, raw WE & raw AE sensor outputs, corrected WE & AE based on Alphasense formulas
[RMSE = The Root Mean Squared Error] // NO2 RMSE = 6.20, error = 10% // O3 RMSE = 8.71, error = 30% // CO RMSE=0.68, error = 35% // PM10 SME = 638.52, error = 26%
Lessons Learned
Despite global enthusiasm for low-cost air quality sensors, our experience revealed that they are not feasible for long-term, large-scale monitoring in Iran. Sanctions make sourcing difficult, sensors have a short lifespan and higher relative costs, and ongoing maintenance and calibration add further burdens. While unsuitable for long-term use, they remain valuable for small-scale citizen-science initiatives and short-term research. For this reason, we ended our large-scale monitoring efforts but continue offering our app to users.
References:
- Smart Citizen Team. Index – iSCAPE Sensors Documentation. [cited 12 Mar 2020]. Available: https://docs.iscape.smartcitizen.me/Sensor%20Analysis%20Framework/
- Maklin C. ARIMA Model Python Example — Time Series Forecasting. In: Medium [Internet]. Towards Data Science; 25 May 2019 [cited 14 Mar 2020]. Available: https://towardsdatascience.com/machine-learning-part-19-time-series-and-autoregressive-integrated-moving-average-model-arima-c1005347b0d7
- Anonymous, Anonymous. Use of electrochemical sensors for measurement of air pollution: correcting interference response and validating measurements. doi:10.5194/amt-2017-138-rc1
- Copenhagen Wheel, City Scanner, Roboat, Urban Sensing all by MIT Senseable City Lab, and Air Quality Egg, Smart Citizen Kit, Making Sense, Clean Air Nairobi, Paper: E. S. Cross et al.: Use of electrochemical sensors for measurement of air pollution